- Home
- /
- Product Management
- /
- Mastering Startup Metrics
Introduction
Launching a startup is an exhilarating journey, filled with innovation, passion, and, of course, challenges. One of the most critical aspects of navigating this path is understanding and leveraging Startup Metrics. These metrics provide invaluable insights into your company’s performance, guiding strategic decisions and ensuring sustainable growth. Whether you’re a budding entrepreneur or a seasoned founder, mastering these metrics can significantly enhance your startup’s trajectory. Let’s delve into the essential startup metrics you need to track, complete with examples and actionable insights.
Key Startup Metrics
Revenue Metrics
Understanding your revenue streams is fundamental to assessing your startup’s health. Let’s explore the key revenue metrics every startup should monitor.
Monthly Recurring Revenue (MRR)
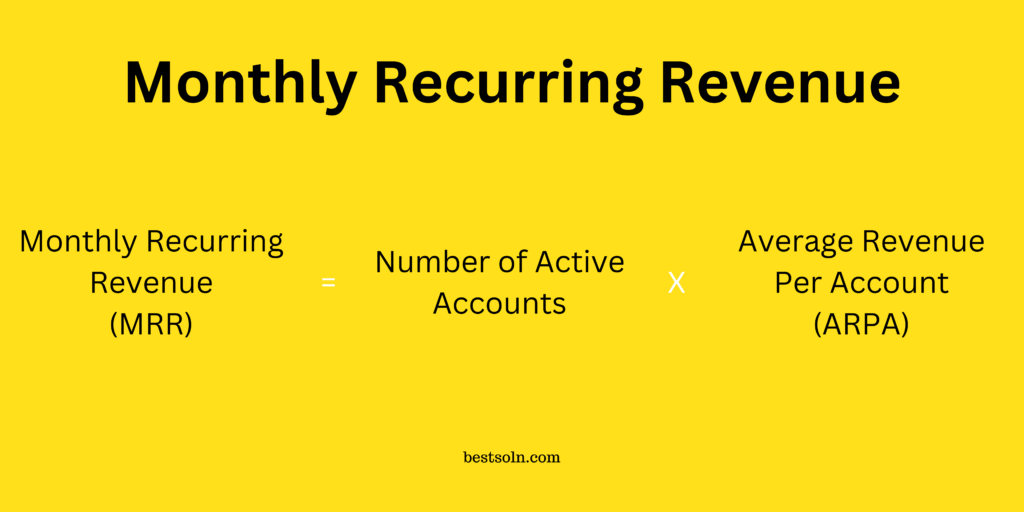
- Monthly Recurring Revenue (MRR) is the lifeblood of subscription-based startups. It represents the predictable revenue you can expect every month from your active subscriptions.
- Why It Matters: MRR provides a clear picture of your revenue stability and growth potential. It helps forecast future revenue and make informed financial decisions.
- Example: If you have 100 subscribers paying $50 each per month, your MRR is $5,000.
Annual Recurring Revenue (ARR)
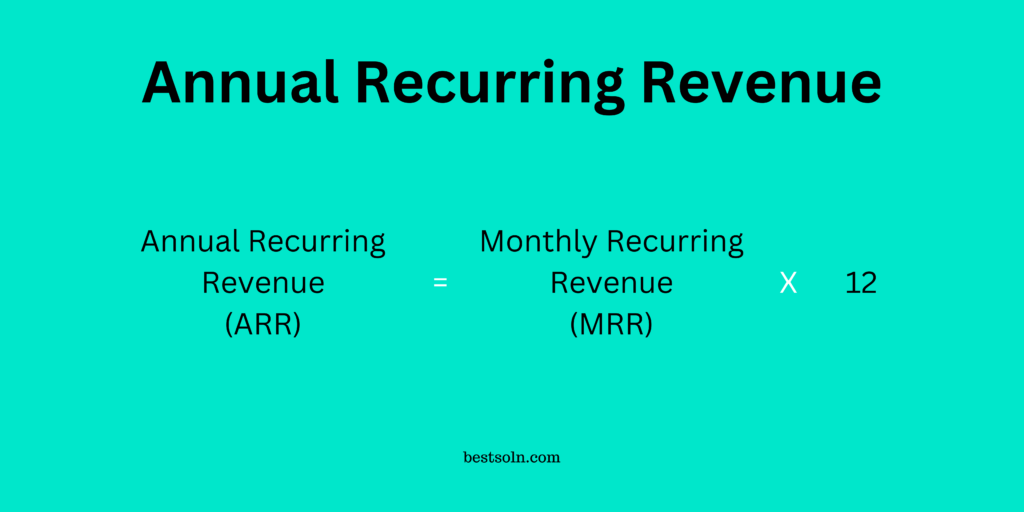
- Annual Recurring Revenue (ARR) extends the concept of MRR over a year. It’s calculated by multiplying your MRR by 12.
- Why It Matters: ARR offers a long-term view of your revenue, smoothing out monthly fluctuations and aiding in strategic planning.
- Example: Using the previous MRR of $5,000, your ARR would be $60,000.
Average Revenue Per Account (ARPA)
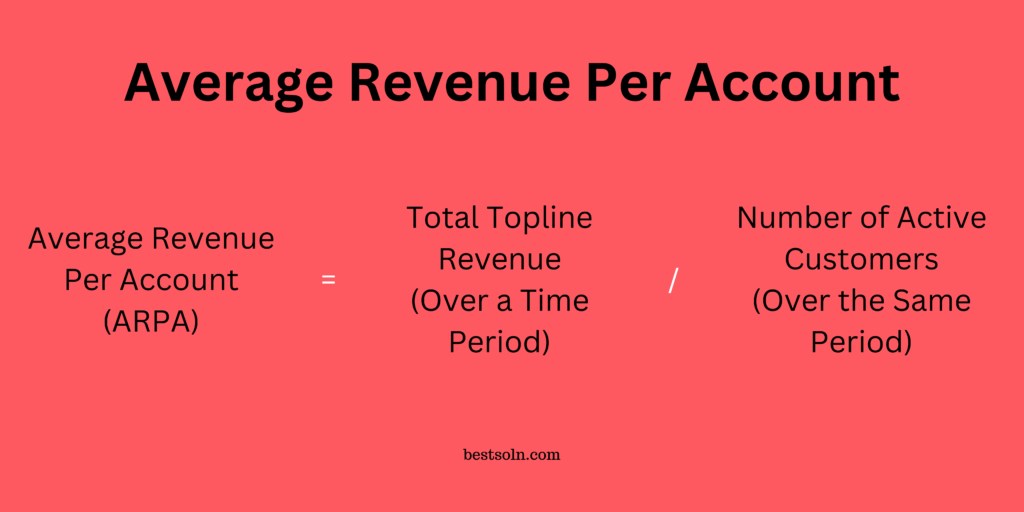
- Average Revenue Per Account (ARPA) measures the average revenue generated from each customer account.
- Why It Matters: ARPA helps in understanding the value each customer brings and can guide pricing strategies and upselling efforts.
- Example: If your total revenue is $10,000 from 200 accounts, your ARPA is $50.
Deferred Revenue
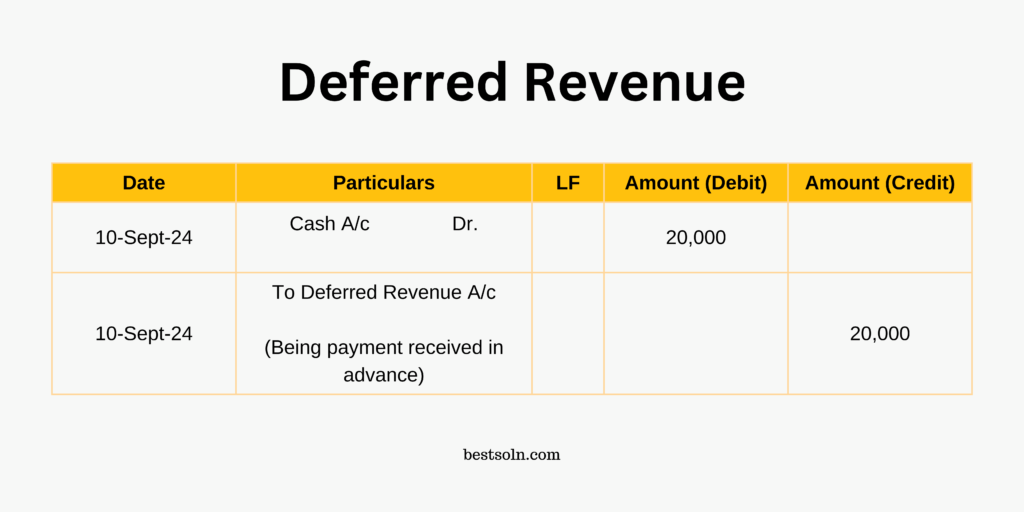
- Deferred Revenue refers to money received for goods or services not yet delivered or performed.
- Why It Matters: It’s crucial for recognizing revenue accurately and understanding future obligations.
- Example: If a customer pays $1,200 upfront for a year-long service, $1,200 is initially recorded as deferred revenue and recognized monthly as $100.
Billings
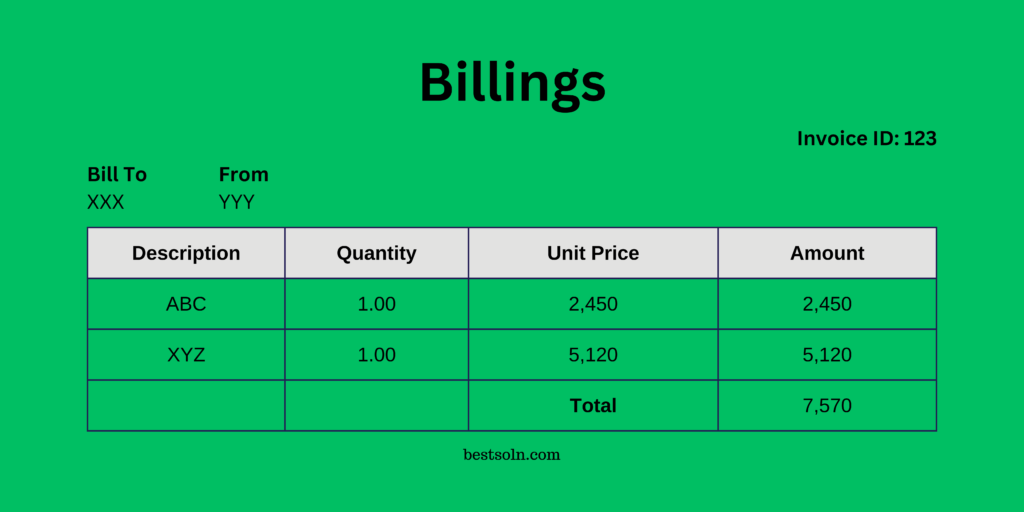
- Billings represent the total amount invoiced to customers within a specific period.
- Why It Matters: Billings indicate sales performance and potential cash flow, reflecting your ability to generate revenue.
- Example: In a month, if you invoice 50 customers $200 each, your total billings are $10,000.
Run Rate
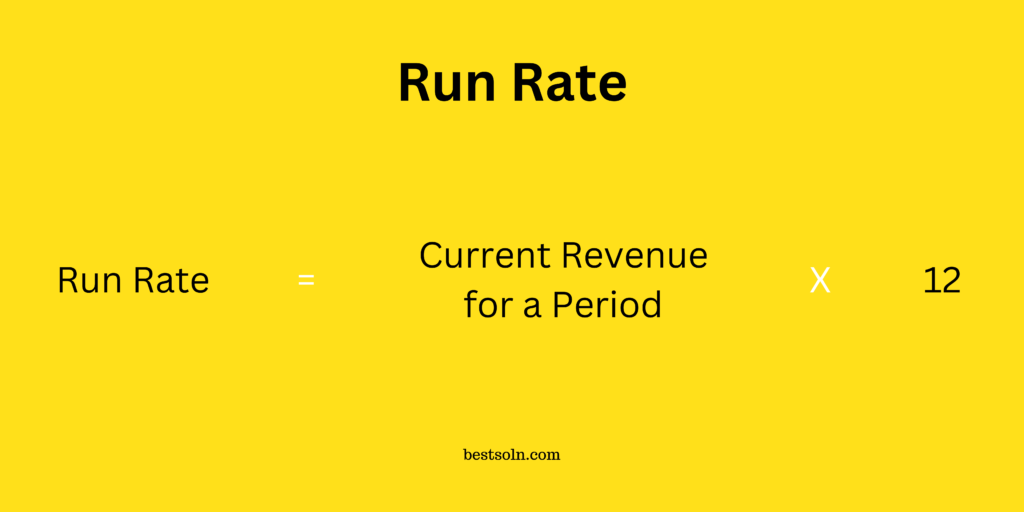
- Run Rate estimates your future revenue by annualizing your current revenue over 12 months.
- Why It Matters: Especially useful for early-stage startups, it helps predict growth and future performance based on current revenue.
- Example: If a startup generated $20,000 in Q1, the run rate for the year would be $80,000 ($20,000 x 4).
Profitability Metrics
Profitability metrics help you gauge how efficiently your startup is generating profit relative to its expenses.
Gross Profit
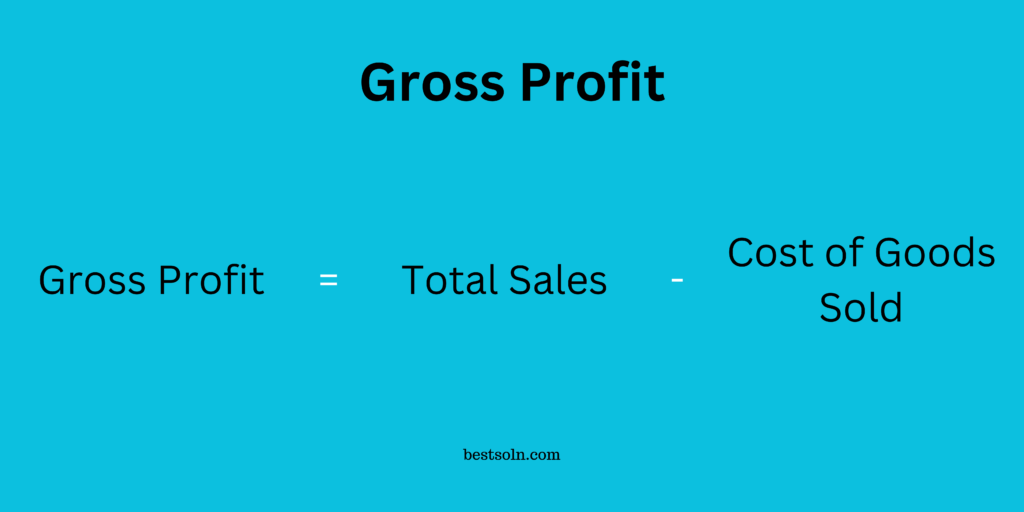
- Gross Profit is the revenue remaining after subtracting the Cost of Goods Sold (COGS).
- Why It Matters: It shows the efficiency of your production and pricing strategies, indicating how much money is available to cover operating expenses.
- Example: If your revenue is $100,000 and COGS is $60,000, your gross profit is $40,000.
Gross Margin
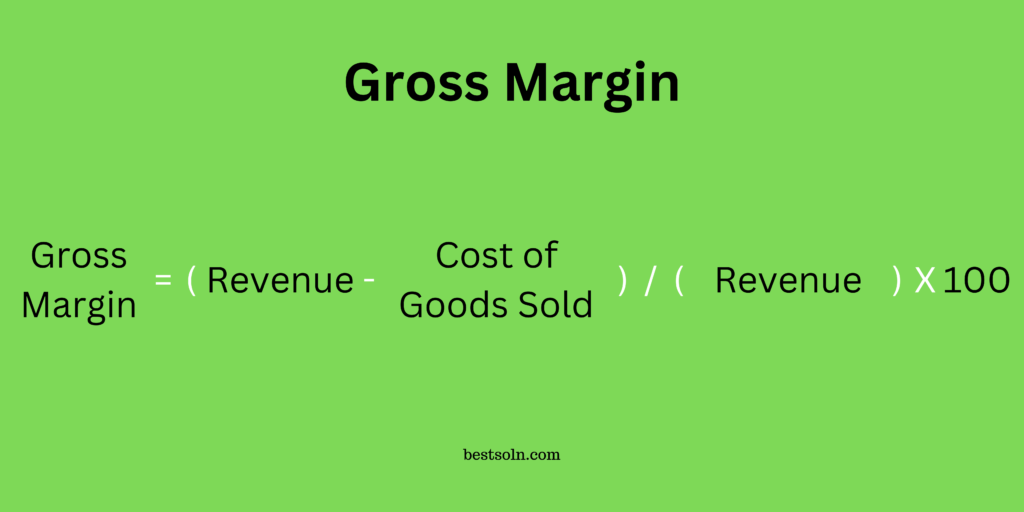
- Gross Margin represents the percentage of revenue left after subtracting the cost of goods sold (COGS).
- Why It Matters: It’s essential for assessing how efficiently a company produces and delivers its products relative to revenue.
- Example: If your revenue is $100,000 and your COGS is $60,000, your gross margin is 40%.
Lifetime Value (LTV)
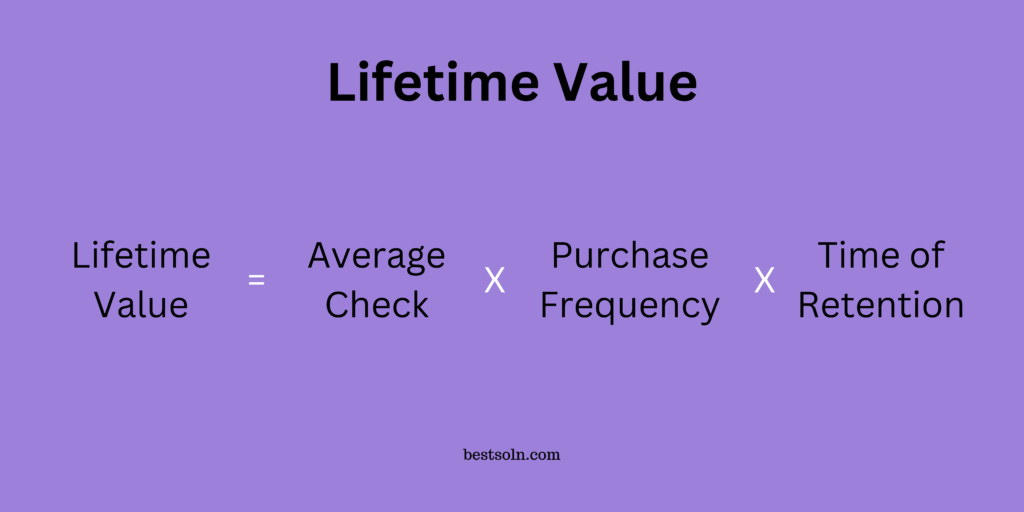
- Lifetime Value (LTV) estimates the total revenue a business can expect from a single customer over their entire relationship.
- Why It Matters: LTV helps determine how much you can afford to spend on acquiring a customer (CAC) and informs long-term profitability.
- Example: If a customer generates $500 over three years, your LTV is $500.
Customer Acquisition Cost (CAC)
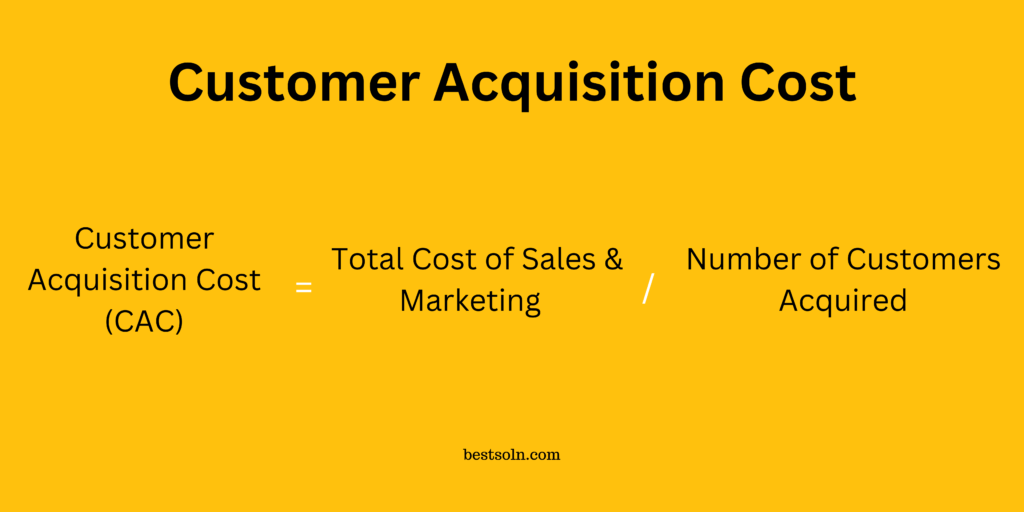
- Customer Acquisition Cost (CAC) calculates the total cost spent on acquiring a new customer.
- Why It Matters: It assesses the efficiency of your sales and marketing efforts and ensures that your customer acquisition strategy is sustainable.
- Example: If you spend $10,000 on marketing and acquire 100 customers, your CAC is $100.
Gross Churn Rate
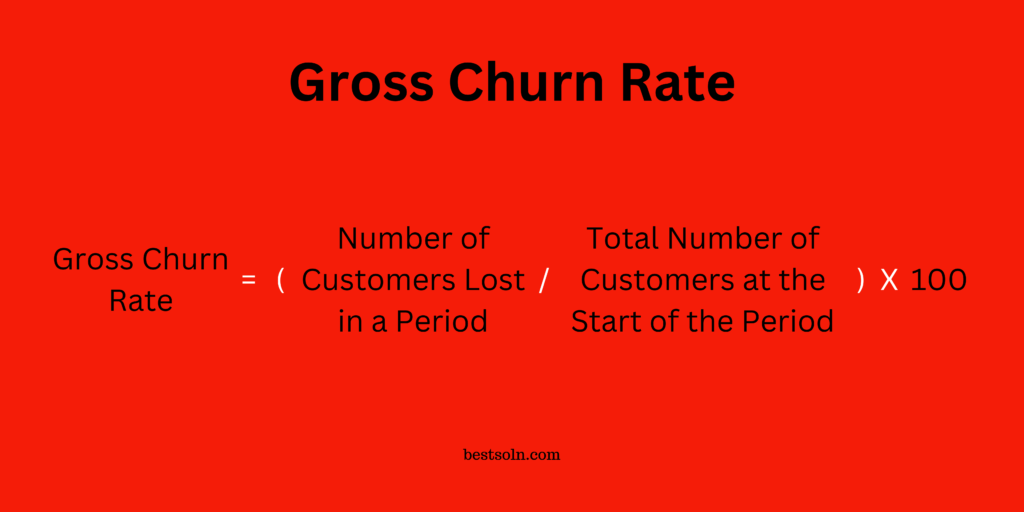
- Gross Churn Rate measures the percentage of customers lost during a specific period.
- Why It Matters: It reflects customer dissatisfaction and the effectiveness of your retention strategies, critical for subscription-based models.
- Example: If you have 200 customers at the start of the month and lose 10, your gross churn rate is 5%.
Net Churn
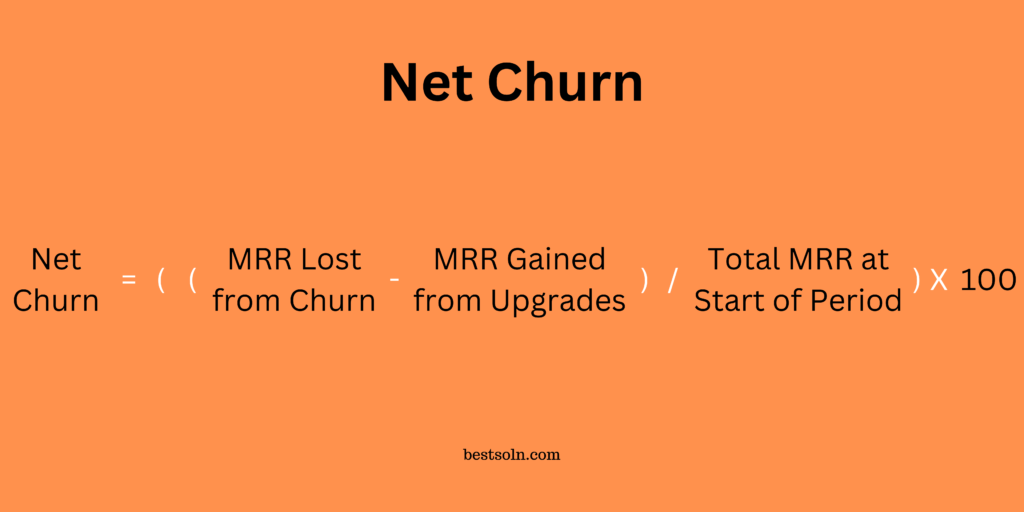
- Net Churn adjusts the gross churn rate by accounting for upgrades or additional purchases, providing a more accurate picture of revenue sustainability.
- Why It Matters: It offers a balanced view of revenue loss and gain, helping to understand overall growth dynamics.
- Example: If you lose $5,000 in revenue but gain $2,000 from upsells, your net churn is -$3,000.
Net Revenue Retention (NRR)
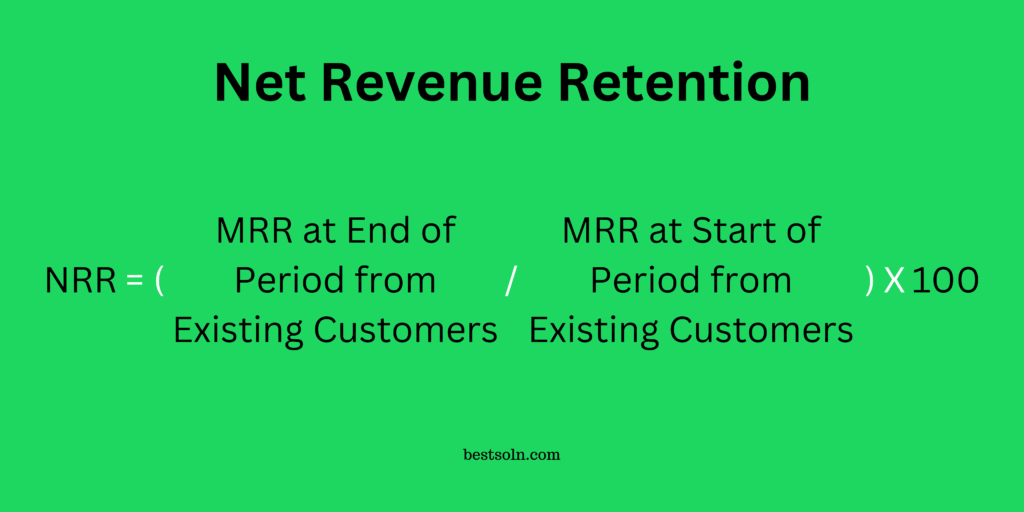
- NRR represents the percentage of revenue retained from existing customers, considering churn, upgrades, and downgrades.
- Why It Matters: NRR is a measure of customer success, demonstrating how well you can grow revenue from your existing customer base.
- Example: If MRR from existing customers was $10,000 at the start of the month and $12,000 by the end (factoring in churn and upgrades), the NRR is 120%.
Burn Rate
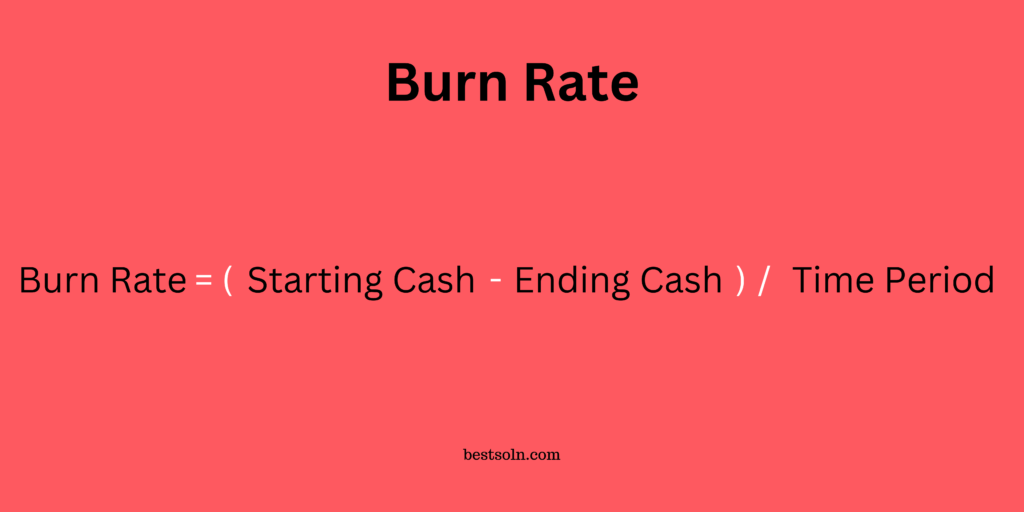
- Burn Rate is the rate at which a startup depletes its cash reserves to cover expenses.
- Why It Matters: Knowing the burn rate helps founders understand how long they can operate before needing additional funding.
- Example: If a startup spends $30,000 each month, its monthly burn rate is $30,000.
Runway
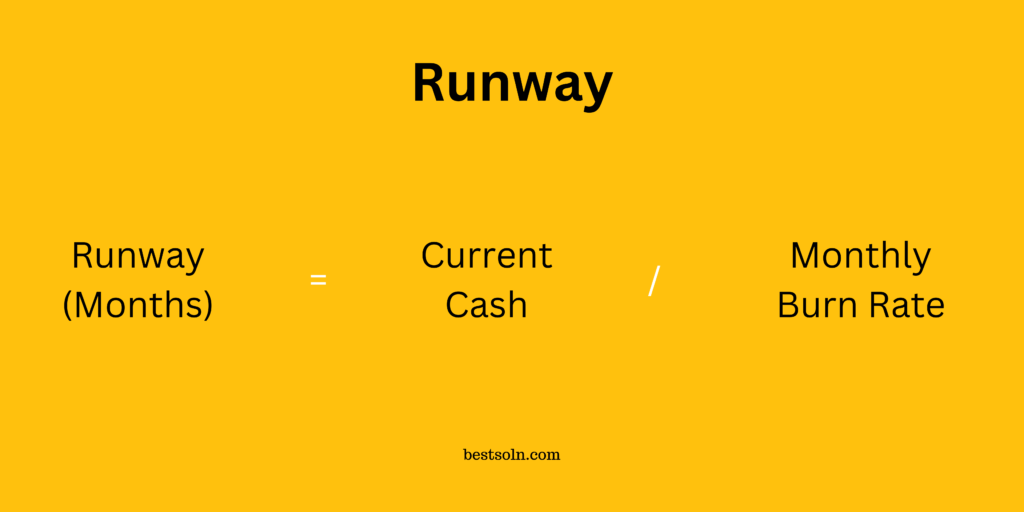
- Runway estimates how long a startup can continue operating with its current cash reserves before running out of money.
- Why It Matters: It’s a critical metric for managing financial health and knowing when to raise more capital.
- Example: If your startup has $300,000 and a burn rate of $50,000/month, your runway is 6 months.
Conversion Rate
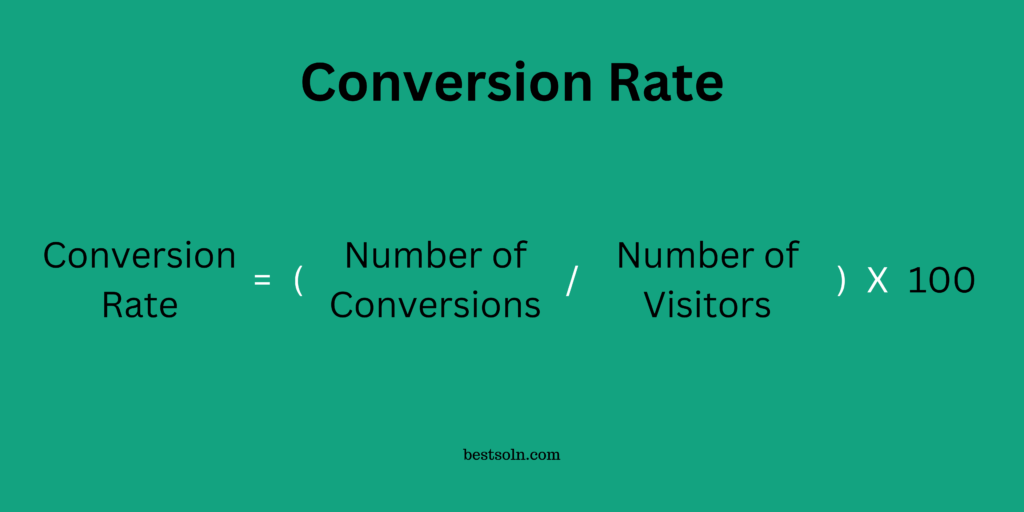
- Conversion Rate is the percentage of visitors who take a desired action, such as making a purchase or signing up.
- Why It Matters: High conversion rates indicate effective marketing and user engagement strategies.
- Example: If 200 out of 1,000 website visitors made a purchase, your conversion rate is 20%.
Growth Metrics
Growth metrics track your startup’s expansion and market penetration, essential for attracting investors and scaling operations.
Compound Annual Growth Rate (CAGR)
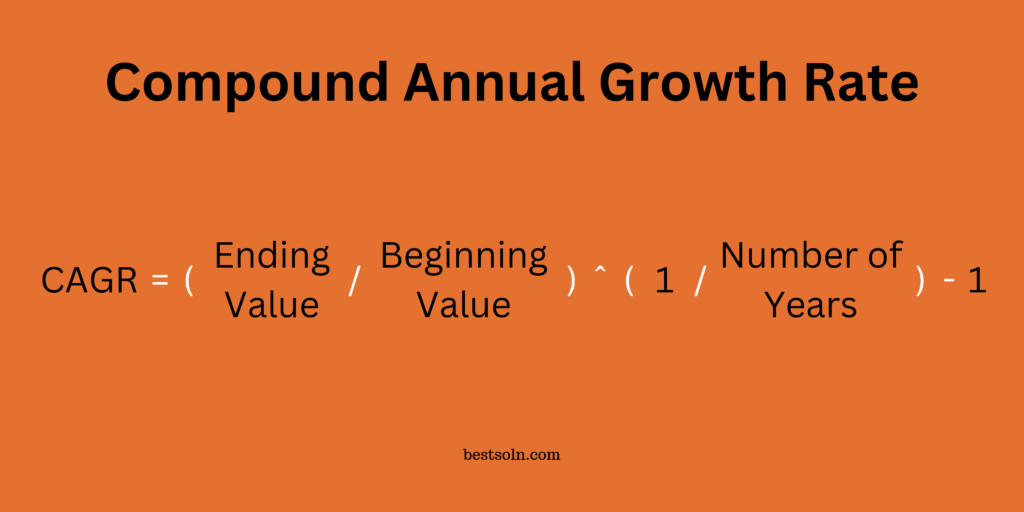
- CAGR is the rate of return required for an investment to grow from its beginning balance to its ending balance, assuming the profits were reinvested each year. It’s used to measure growth over multiple years.
- Why It Matters: CAGR smooths out volatility and provides a consistent rate of growth over time, making it valuable for comparing growth between companies or investments.
- Example: If a startup’s revenue grew from $500,000 to $1,000,000 over three years, the CAGR would be 25.99%.
Month-over-Month Growth Rate (MoM)
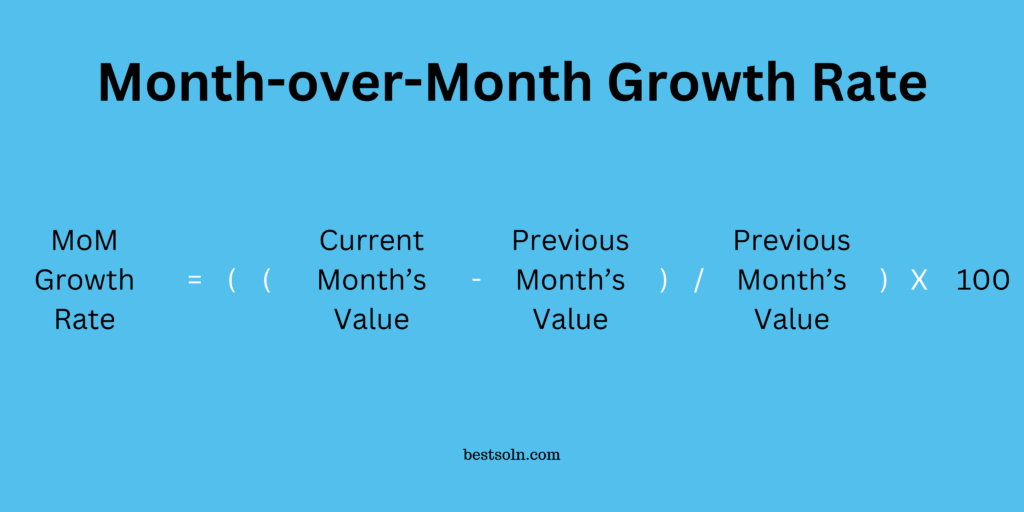
- Month-over-Month Growth Rate (MoM) measures the percentage growth of a metric from one month to the next.
- Why It Matters: It helps in understanding short-term growth trends and the effectiveness of recent strategies.
- Example: If your MRR grows from $10,000 to $12,000 in a month, your MoM growth rate is 20%.
Compound Monthly Growth Rate (CMGR)
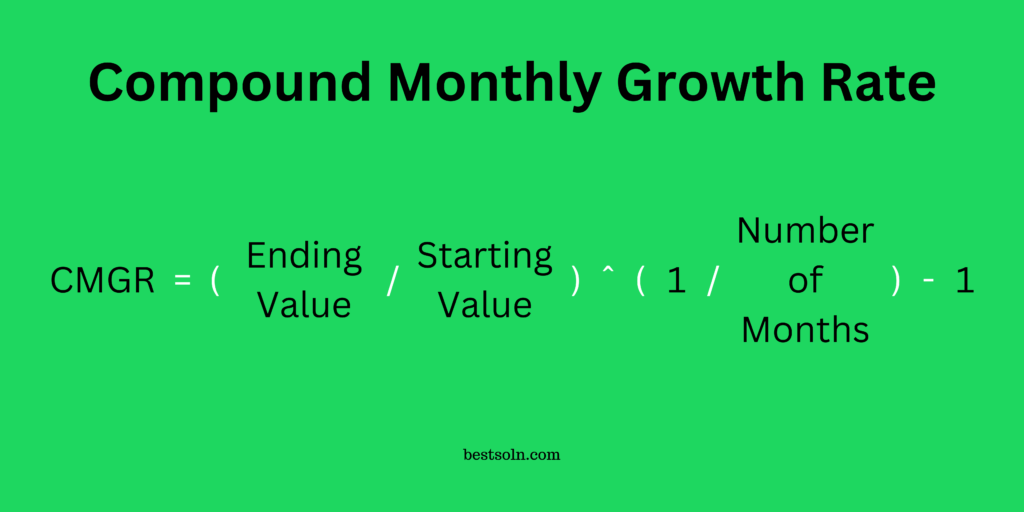
- Compound Monthly Growth Rate (CMGR) calculates the average monthly growth rate over a specified period, smoothing out fluctuations.
- Why It Matters: CMGR provides a clearer picture of your growth trajectory, especially useful for long-term planning.
- Example: If your MRR grows from $10,000 to $20,000 over six months, your CMGR is approximately 12.25%.
Lead Velocity Rate (LVR)
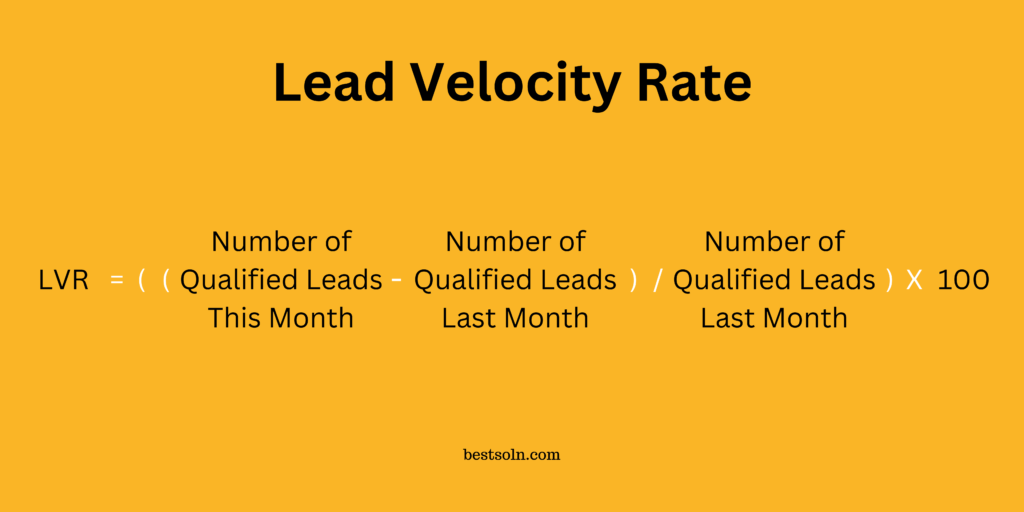
- Lead Velocity Rate (LVR) measures the month-over-month growth in the number of qualified leads a business generates. It helps gauge how effectively the business is growing its sales pipeline.
- Why It Matters: LVR is a forward-looking metric that predicts future revenue growth. Unlike lagging indicators like revenue, LVR gives startups insight into the health and growth of their sales pipeline, allowing them to anticipate future performance and adjust strategies.
- Example: If a startup had 200 qualified leads in January and 240 in February, the LVR is calculated as follows:
Total Addressable Market (TAM)
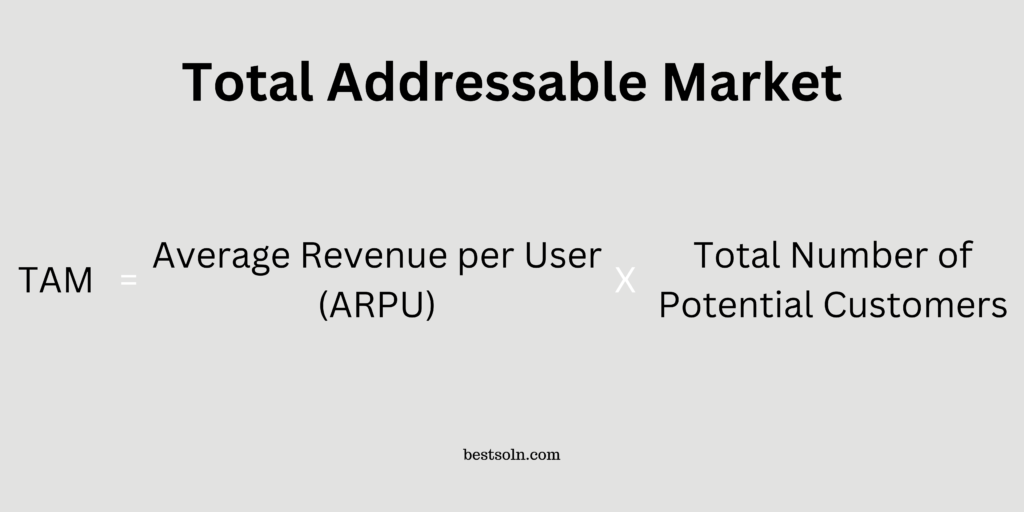
- Total Addressable Market (TAM) represents the total revenue opportunity available if a product achieves 100% market share.
- Why It Matters: TAM highlights the full potential of your business and is crucial for strategic planning and attracting investors.
- Example: If the global market for your SaaS product is estimated at $1 billion, your TAM is $1 billion.
Serviceable Addressable Market (SAM)
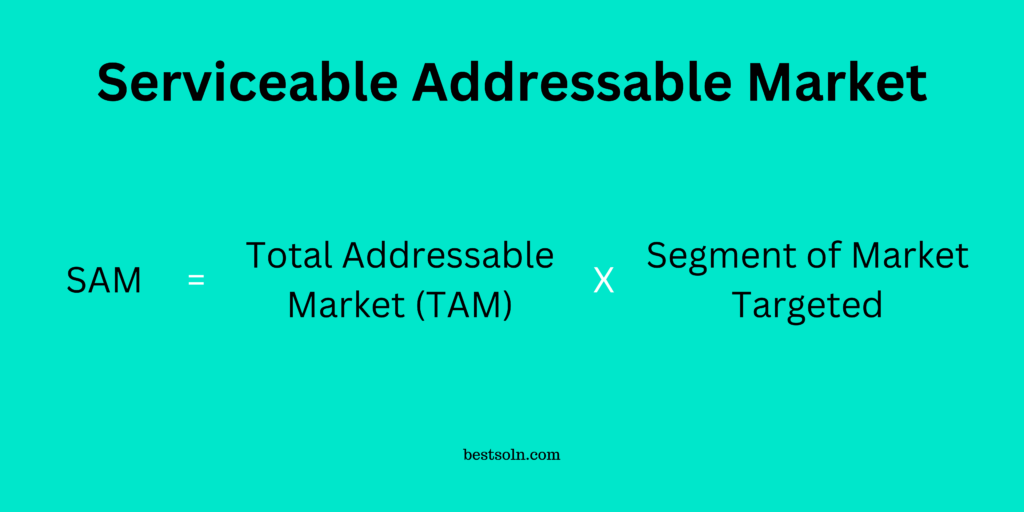
- Serviceable Addressable Market (SAM) is the segment of TAM targeted by your products or services within your geographical and operational reach.
- Why It Matters: SAM narrows down the market to what’s realistically attainable, helping focus sales and marketing efforts.
- Example: If your SaaS product targets only North America, and that market is worth $300 million, your SAM is $300 million.
Serviceable Obtainable Market (SOM)
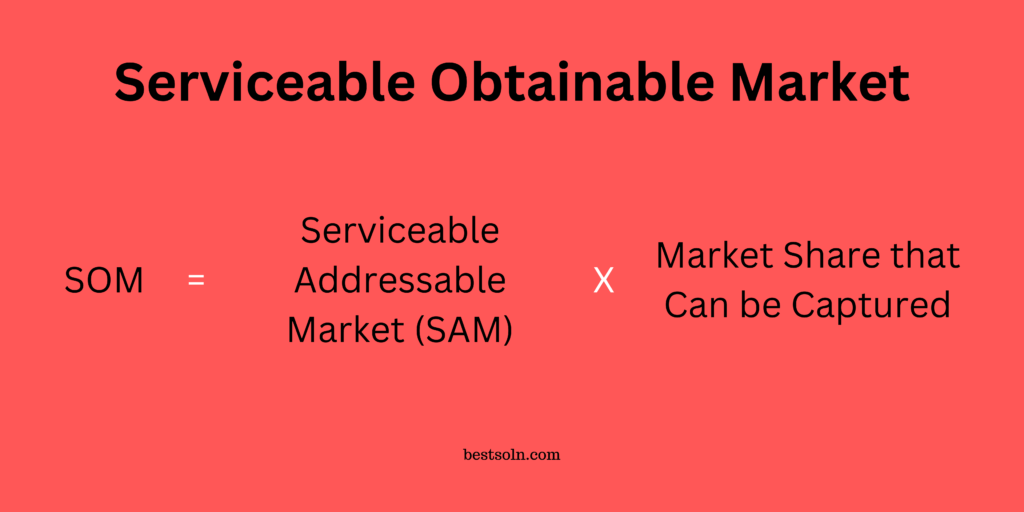
- Serviceable Obtainable Market (SOM) is the portion of SAM that your company can realistically capture.
- Why It Matters: SOM helps in setting practical sales and marketing goals, ensuring that targets are achievable.
- Example: If you aim to capture 10% of your SAM, your SOM would be $30 million.
User Engagement Metrics
User engagement metrics provide insights into how users interact with your product, indicating its value and usability.
Daily Active Users (DAU)
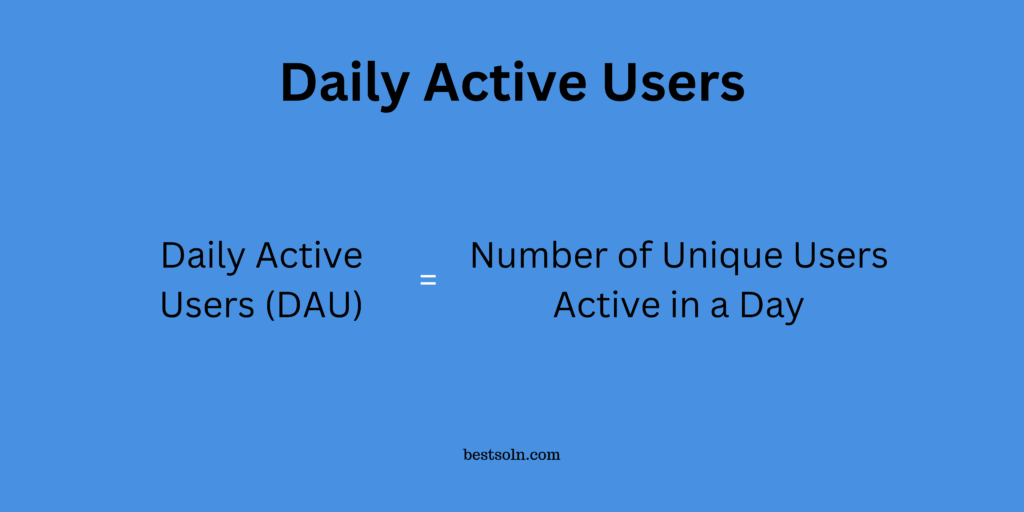
- Daily Active Users (DAU) counts the number of unique users who engage with your product daily.
- Why It Matters: DAU reflects user engagement and product stickiness, essential for understanding daily usage patterns.
- Example: If 1,000 unique users log in each day, your DAU is 1,000.
Monthly Active Users (MAU)
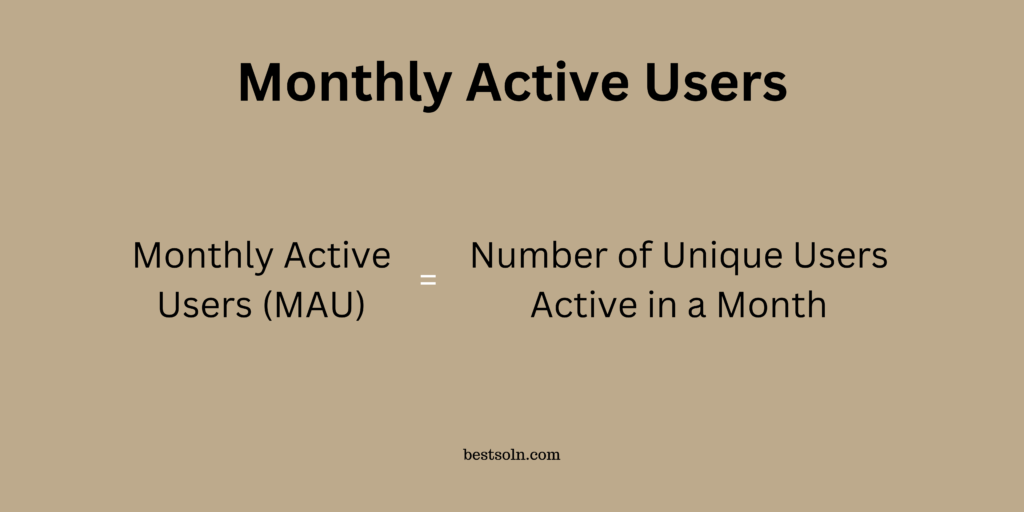
- Monthly Active Users (MAU) measures the number of unique users who interact with your product monthly.
- Why It Matters: MAU gives a broader view of your user base and long-term engagement trends.
- Example: If 10,000 unique users engage with your product in a month, your MAU is 10,000.
Number of Logins
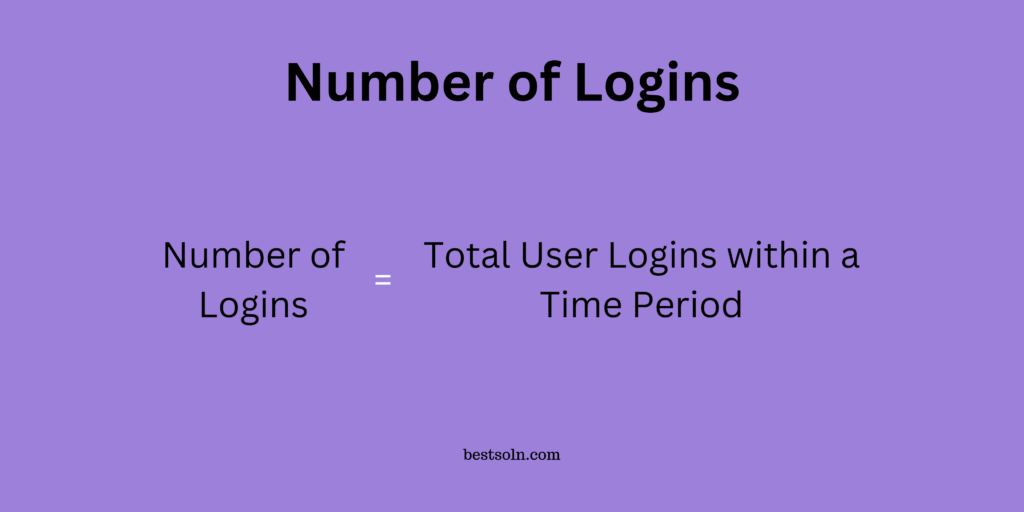
- Number of Logins tracks how frequently users log into your platform.
- Why It Matters: It indicates user interaction and engagement levels, helping identify active versus passive users.
- Example: If users log in an average of 5 times a month, it suggests regular engagement.
Activation Rate
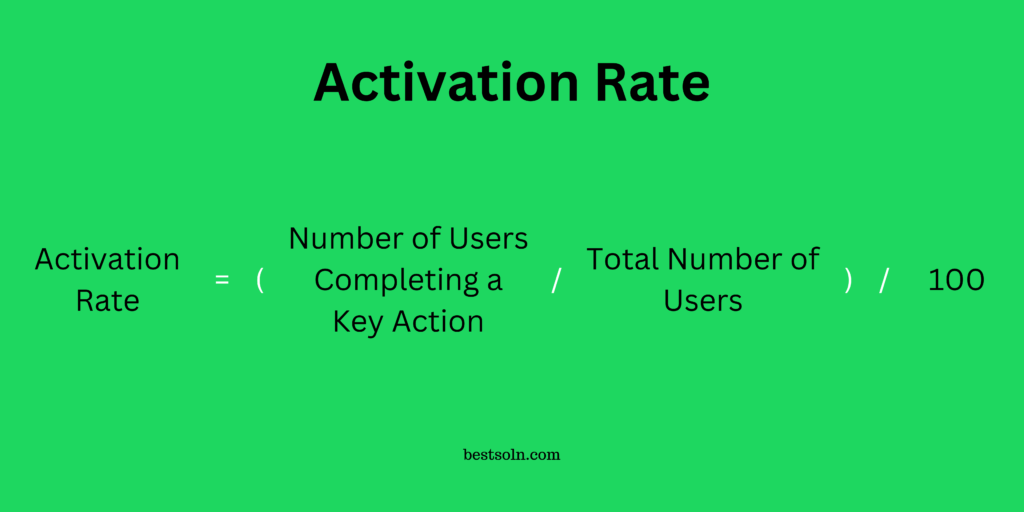
- Activation Rate is the percentage of users who complete a key action that signifies value realization, such as setting up a profile or making a first purchase.
- Why It Matters: It measures the effectiveness of your onboarding process and initial user experience.
- Example: If 500 out of 1,000 new users complete the activation step, your activation rate is 50%.
Retention Rate
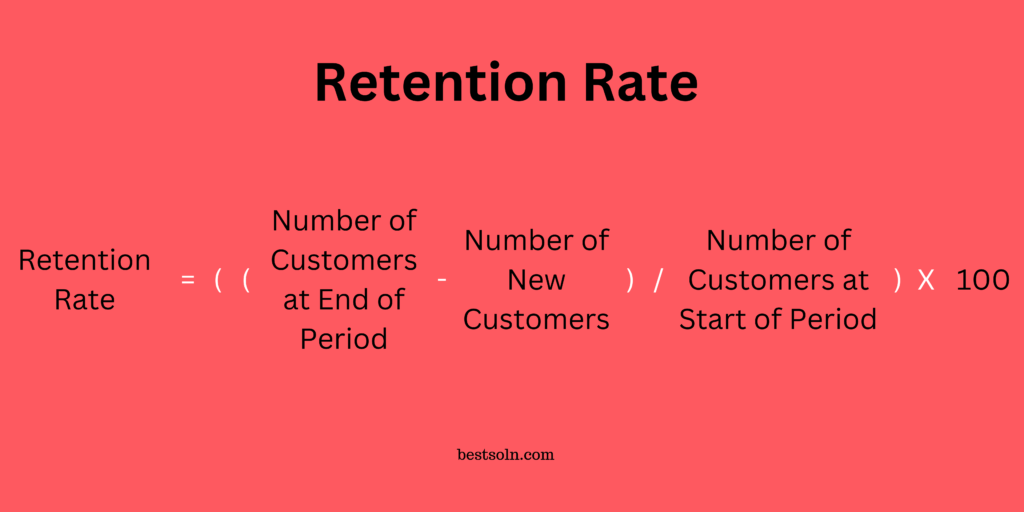
- Retention Rate measures the percentage of users who continue to use your product over a specific period.
- Why It Matters: High retention indicates customer satisfaction and product value, crucial for long-term success.
- Example: If 800 out of 1,000 users remain active after three months, your retention rate is 80%.
Net Promoter Score (NPS)
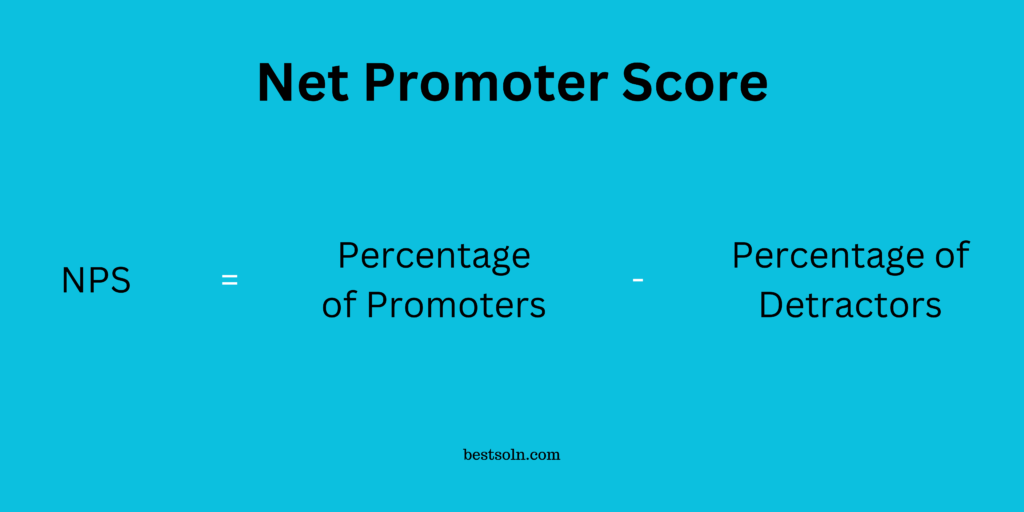
- NPS is a metric that measures customer loyalty and satisfaction by asking customers how likely they are to recommend your product or service to others on a scale from 0 to 10. Based on their responses, customers are categorized as Promoters (9-10), Passives (7-8), and Detractors (0-6).
- Why It Matters: NPS is a key indicator of customer loyalty and potential for growth through word-of-mouth. A high NPS reflects positive customer experiences, which can drive organic growth, while a low NPS indicates dissatisfaction that needs attention.
- Example: If a company surveys 100 customers and receives 50 Promoters, 30 Passives, and 20 Detractors, the NPS would be 30 indicating a relatively high level of customer satisfaction and loyalty.
Risk and Sustainability Metrics
Assessing risks and ensuring sustainability are vital for maintaining a healthy startup environment.
Concentration Risk
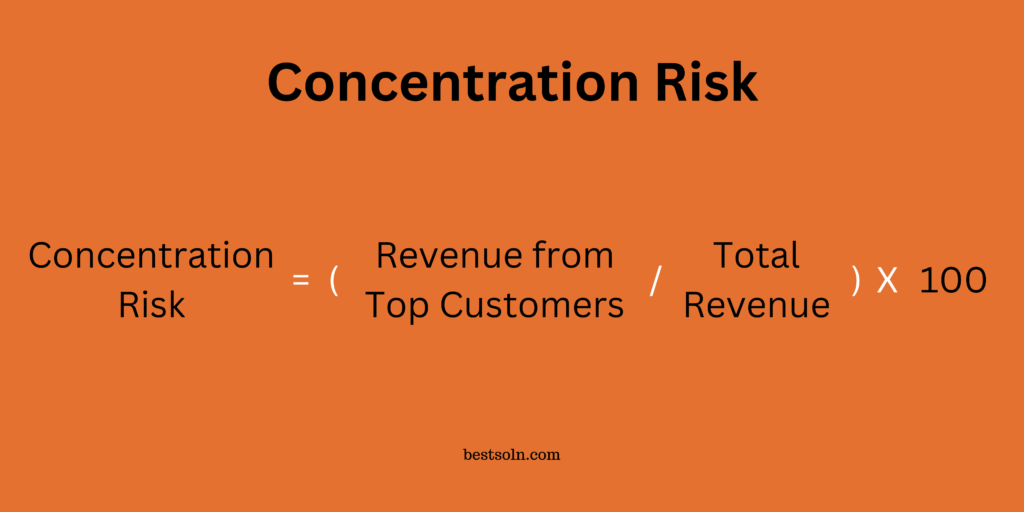
- Concentration Risk refers to the risk of relying heavily on a few customers, products, or revenue streams.
- Why It Matters: It highlights vulnerabilities in your business model, ensuring diversification to mitigate potential losses.
- Example: If 60% of your revenue comes from three clients, you have a high concentration risk.
Monthly Cash Burn Rate
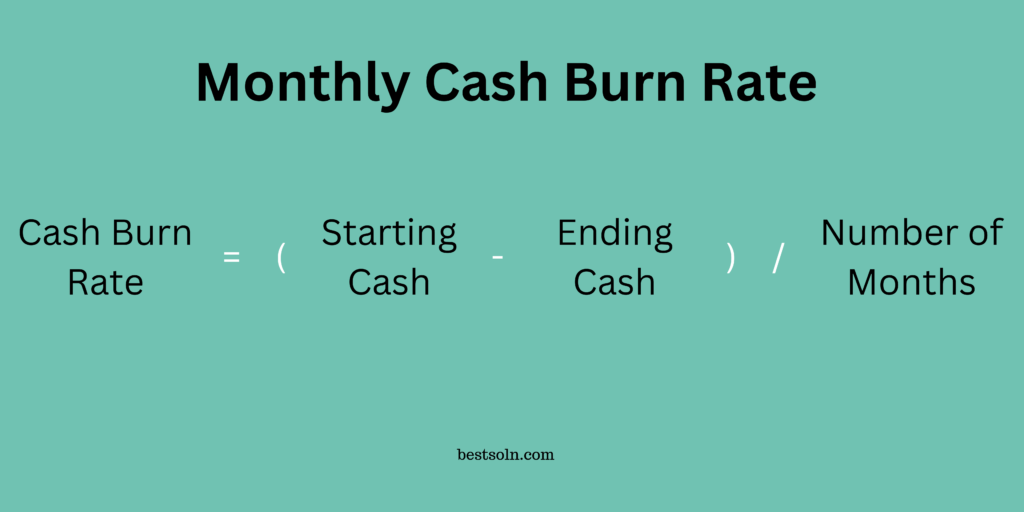
- Monthly Cash Burn Rate calculates the rate at which a startup spends cash every month.
- Why It Matters: It’s essential to understand how long your company can operate before needing additional funding, guiding budgeting, and financial planning.
- Example: If your startup spends $50,000 monthly and has $200,000 in the bank, your cash burn rate gives you four months before needing more funds.
Conclusion
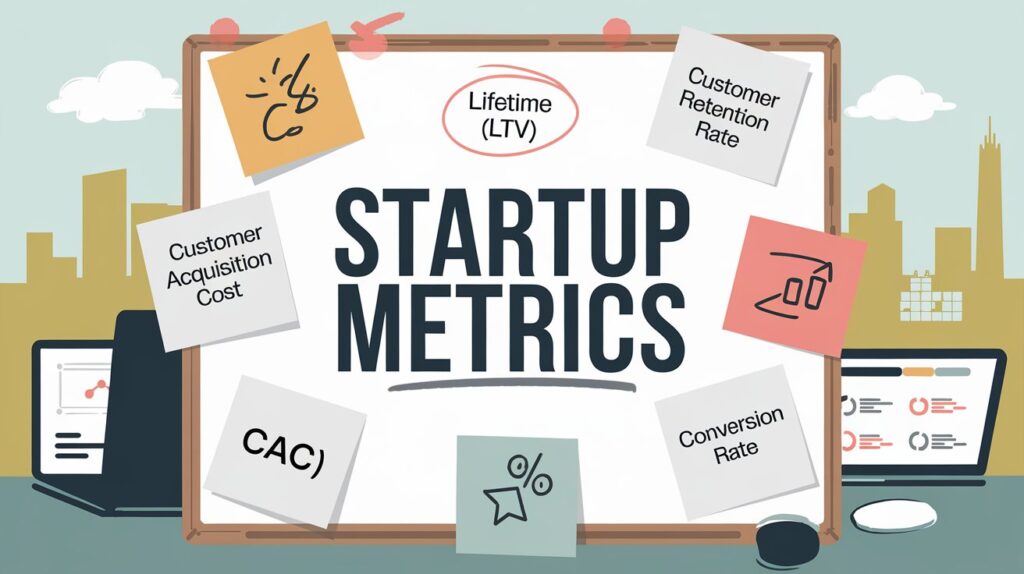
Mastering Startup Metrics is not just about tracking numbers; it’s about gaining actionable insights that drive your startup toward success. From understanding your revenue streams with MRR and ARR to gauging user engagement through DAU and MAU, each metric plays a pivotal role in shaping your business strategy. Additionally, keeping an eye on profitability metrics like LTV and CAC ensures that your growth is sustainable and financially sound.
Moreover, growth metrics such as MoM and CMGR provide a clear picture of your expansion trajectory, while risk metrics like concentration risk and cash burn rate safeguard your startup against unforeseen challenges. By diligently monitoring these metrics, you equip yourself with the knowledge to make informed decisions, attract investors, and ultimately steer your startup toward a thriving future.
Remember, while metrics are essential, they should complement your vision and adaptability. Stay focused, keep analyzing, and let the data guide you to new heights. Embrace the journey with confidence, knowing that you have the tools to measure and achieve your startup’s success.
Enjoyed this article? Dive deeper into entrepreneurship with our detailed guide—check it out here. Plus, explore our curated resources on entrepreneurship right here.




Leave a Reply